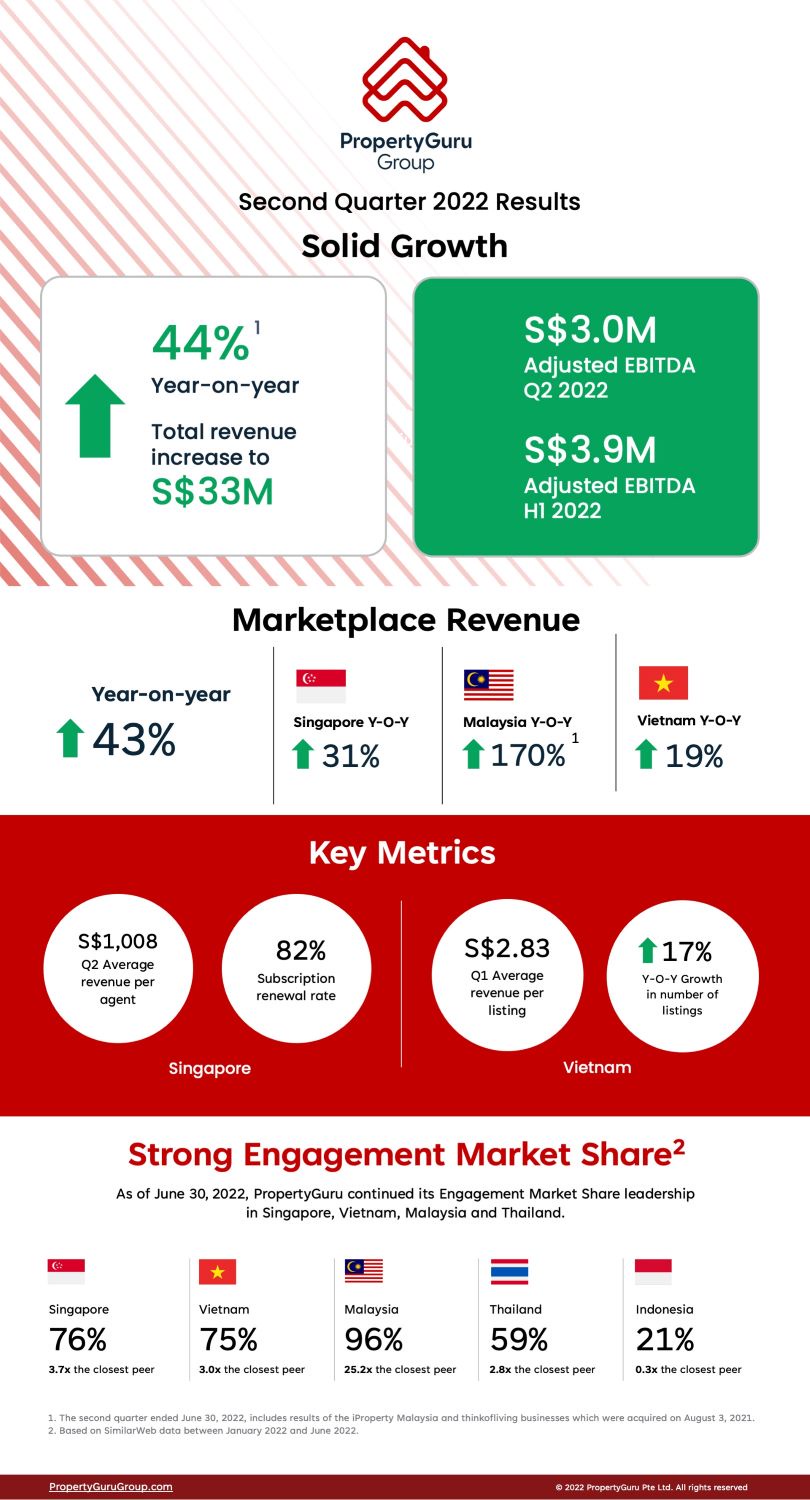
- Total revenue of S$33.0 million in the second quarter 2022 and S$61.3 million in the first half of 2022
- Adjusted EBITDA was S$3.0 million in the second quarter 2022 and S$3.9 million in the first half of 2022
PropertyGuru Group Limited (NYSE: PGRU) ("PropertyGuru" or the "Company"), Southeast Asia's leading[1], property technology ("PropTech") company, today announced financial results for the quarter ended June 30, 2022[2]. Net income and Adjusted EBITDA[3] were S$3.8 million and S$3.0 million, respectively, which compares to a net loss of S$139.8 million[4] and Adjusted EBITDA loss of S$2.0 million in the prior year period. Revenue of S$33.0 million in the second quarter 2022 increased 44% year over year.
Management Commentary
Hari V. Krishnan, Chief Executive Officer and Managing Director, PropertyGuru, said "Second quarter results built on the strong start to the year. The strategy of increasing our customer value proposition is proving effective, as we see the return on investments made over the past few years. The second quarter saw us deliver more tools and features that further enhance the customer experience as the pace of our internal innovation accelerates. Going forward, we expect to capitalize on both organic and inorganic opportunities to further expand our world-class solutions to customers. Even with our growing business strength, we remain vigilant around potential market challenges from rising inflation and interest rates and other global macro headwinds."
Joe Dische, Chief Financial Officer, PropertyGuru, added "Second quarter revenues were up 44% year over year, building on the first quarter's solid performance and setting us up for a strong back half of 2022. Growth was balanced across all business segments and the further leveraging of our cost structure helped drive positive Adjusted EBITDA."
Financial Highlights - Second Quarter 2022
- Total revenue of S$33.0 million increased 44% year over year and was balanced with growth across all markets and business segments.
- Marketplaces revenues increased by 43% year over year to S$32.0 million. Investments made over the last two years are gaining traction now as real estate markets emerge from the pandemic-induced slowdown.
- Singapore Marketplaces revenue increased 31% to S$17.3 million. Quarterly Average Revenue Per Agent ("ARPA") of S$1,008 rose 29% year over year through improved yield derived from previous price rises and increased activity on our platform. We had a total of 15,023 agents with a renewal rate of 82%, reflecting a strong local property market.
- Malaysia Marketplaces revenue increased 170% to S$5.9 million from S$2.2 million in the prior year period as a result of the acquisition of the iProperty business in August 2021.
- Vietnam Marketplaces revenue increased by 19% to S$6.9 million from S$5.8 million in the prior year period. This was driven by both a 17% increase in the number of listings to 2.38 million and a 7% increase in average revenue per listing ("ARPL") to S$2.83.
- At quarter-end, cash and cash equivalents was $368.8 million.
For the Three Months Ended June 30 2022 2021 YoY Growth (S$ in thousands except percentages) Revenue 33,031 23,003 43.6%Marketplaces 32,001 22,328 43.3% Singapore 17,293 13,246 30.6% Vietnam 6,943 5,835 19.0% Malaysia 5,899 2,187 169.7% Other Asia 1,866 1,060 76.0%Fintech and data services 1,030 675 52.6%Adjusted EBITDA 3,011 (1,950) Marketplaces 12,964 6,805 Singapore 11,233 8,601 Vietnam 1,669 1,869 Malaysia 1,241 (2,439) Other Asia (1,179) (1,226) Fintech and data services (1,885) (1,351) Corporate* (8,068) (7,404) Adjusted EBITDA Margin (%)9.1% -8.5% Marketplaces40.5% 30.5% Singapore65.0% 64.9% Vietnam24.0% 32.0% Malaysia21.0% -111.5% Other Asia-63.2% -115.7% Fintech and data services-183.0% -200.1% For the Six Months Ended June 30 2022 2021 YoY Growth (S$ in thousands except percentages) Revenue 61,263 42,890 42.8%Marketplaces 59,214 41,537 42.6% Singapore 32,297 25,359 27.4% Vietnam 11,999 10,098 18.8% Malaysia 11,333 4,046 180.1% Other Asia 3,585 2,034 76.3%Fintech and data services 2,049 1,353 51.4%Adjusted EBITDA 3,895 (4,772) Marketplaces 26,616 10,884 Singapore 22,631 16,932 Vietnam 2,806 2,778 Malaysia 3,610 (6,931) Other Asia (2,431) (1,895) Fintech and data services (3,531) (2,093) Corporate* (19,190) (13,563) Adjusted EBITDA Margin (%)6.4% -11.1% Marketplaces44.9% 26.2% Singapore70.1% 66.8% Vietnam23.4% 27.5% Malaysia31.9% -171.3% Other Asia-67.8% -93.2% Fintech and data services-172.3% -154.7%
Information regarding our operating segments is presented below.
*Corporate consists of headquarters costs, which are not allocated to the segments. Headquarters costs are costs of PropertyGuru's personnel that are based predominantly in its Singapore headquarters and certain key personnel in Malaysia and Thailand, and that service PropertyGuru's group as a whole, consisting of its executive officers and its group marketing, technology, product, human resources, finance and operations teams, as well as platform IT costs (hosting, licensing, domain fees), workplace facilities costs, corporate public relations retainer costs and professional fees such as audit, legal and consultant fees. Certain elements of marketing expenses previously allocated to Corporate in the first quarter 2022 have since been moved to business segments in line with changes to internal reporting lines.
Strong Category Leadership Drives Long-Term Growth Opportunities
As of June 30, 2022, PropertyGuru continued its Engagement Market Share[5] leadership in Singapore, Vietnam, Malaysia and Thailand.
- Singapore: 76% - 3.7x the closest peer
- Vietnam: 75% - 3.0x the closest peer
- Malaysia: 96% - 25.2x the closest peer
- Thailand: 59% - 2.8x the closest peer
- Indonesia: 21% - 0.3x the closest peer
Full Year 2022 Outlook
The Company reiterates its full year 2022 outlook of approximately 44% revenue growth, driven by the strong start to 2022 and growth across all core markets. The Company expects to return to full year positive Adjusted EBITDA, as it realizes the full benefits of its pandemic-period investments in people, technology, and marketing. The Company cautions that this outlook could be impacted by uncertainty around rising inflation and interest rates, government policy and fiscal intervention, political instability, and other macro factors.
Conference Call and Webcast Details
The Company will host a conference call and webcast on Thursday, August 25, 2022, at 8:00 a.m. Eastern Standard Time / 8:00 p.m. Singapore Standard Time to discuss the Company's financial results and outlook.
The PropertyGuru (NYSE: PGRU) Q2 2022 Earnings call can be accessed by registering at:
https://propertyguru.zoom.us/webinar/register/WN_E0YIQzANThSqwAaVqFXUiA
An archived version will be available on the Company's Investor Relations website after the call at https://investors.propertygurugroup.com/news-and-events/events-and-presentations/default.aspx
About PropertyGuru Group
PropertyGuru is Southeast Asia's leading1 PropTech company, and the preferred destination for over 40 million property seekers[6] to find their dream home, every month. PropertyGuru empowers property seekers with more than 3.5 million real estate listings[7], in-depth insights, and solutions that enable them to make confident property decisions across Singapore, Malaysia, Thailand, Indonesia, and Vietnam.
PropertyGuru.com.sg was launched in 2007 and has helped to drive the Singapore property market online and has made property search transparent for the property seeker. In the last 15 years, PropertyGuru has grown into a high-growth PropTech company with a robust portfolio of leading property portals across its core markets; award-winning mobile apps; a high quality developer sales enablement platform, FastKey; mortgage marketplace PropertyGuru Finance; and a host of other property offerings including Awards, events and publications across Asia.
For more information, please visit: PropertyGuruGroup.com; PropertyGuru Group on LinkedIn.
[1] Based on SimilarWeb data between January 2022 and June 2022.
[2] The second quarter and first half ended June 30, 2022 includes results of the iProperty Malaysia and thinkofliving businesses which were acquired on August 3, 2021.
[3] Included in the S$0.8 million of adjustments between net income and Adjusted EBITDA in the second quarter of 2022 were a positive change in the fair value of preferred shares, warrant liability and embedded derivatives of S$11.9 million and S$5.9 million of depreciation and amortization expense.
[4] Included in the S$137.8 million of adjustments between net loss and Adjusted EBITDA in the second quarter of 2021 were a negative change in the fair value of preferred shares, warrant liability and embedded derivatives of S$125.1 million and S$4.9 million of finance costs - net.
[5] Based on SimilarWeb data between January 2022 and June 2022.
[6] Based on Google Analytics data between January 2022 and June 2022.
[7] Based on data between January 2022 and June 2022.
Source: FAQ